Multiple Choice
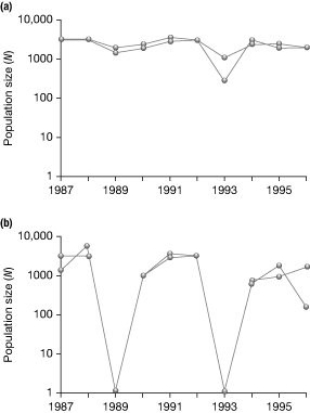 Graph (b) in the accompanying figure shows the normal fluctuations of a population of grouse. Assuming graph (a) in the figure is the result of some experimental treatment in the grouse population, what can be concluded?
A) The experimental treatment exacerbated the population cycling.
B) The experimental treatment did not affect population cycling in this species.
C) The experimental treatment has most likely identified the cause of population cycling.
D) None of the other responses is true.
Correct Answer:

Verified
Correct Answer:
Verified
Q38: <img src="https://d2lvgg3v3hfg70.cloudfront.net/TB3735/.jpg" alt=" The figure shown
Q39: <img src="https://d2lvgg3v3hfg70.cloudfront.net/TB3735/.jpg" alt=" -In the accompanying
Q40: Why do populations grow more slowly as
Q41: You observe two female fish of the
Q42: Which of the following statements regarding the
Q44: Which of the following best defines a
Q45: <img src="https://d2lvgg3v3hfg70.cloudfront.net/TB3735/.jpg" alt=" Looking at the
Q46: Natural selection involves energetic trade-offs between _.<br>A)
Q47: What cannot be determined from examining age
Q48: The definition of a generation is _.<br>A)