Multiple Choice
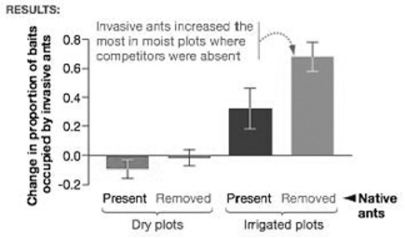 The accompanying graph shows data from a research study designed to test the hypothesis that both abiotic and biotic factors can affect the distribution of invasive Argentine ants. Using the graph, identify the statement that is best supported by the data.
A) Abiotic factors (e.g., soil moisture) only affect the distribution of invasive Argentine ants.
B) Biotic factors (e.g., competition) only affect the distribution of invasive Argentine ants.
C) Both abiotic and biotic factors interact to affect the distribution of invasive Argentine ants.
D) Neither abiotic nor biotic factors affect the distribution of invasive Argentine ants.
Correct Answer:

Verified
Correct Answer:
Verified
Q3: Which of the following is responsible for
Q6: The diagram shows a generalized cross section
Q7: How does solar radiation (per unit area)
Q8: <img src="https://d2lvgg3v3hfg70.cloudfront.net/TB3735/.jpg" alt=" -Based
Q9: <img src="https://d2lvgg3v3hfg70.cloudfront.net/TB3735/.jpg" alt=" In the map
Q10: Which of the following levels of ecological
Q11: <img src="https://d2lvgg3v3hfg70.cloudfront.net/TB3735/.jpg" alt=" -Based
Q15: <img src="https://d2lvgg3v3hfg70.cloudfront.net/TB3735/.jpg" alt=" -Which of the
Q16: Which of the following can be said
Q24: The diagram shows a generalized cross section