Multiple Choice
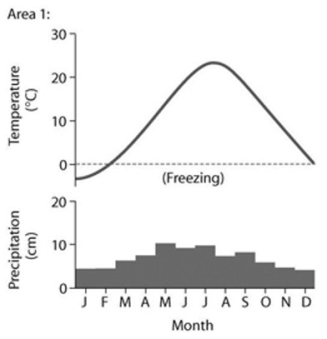
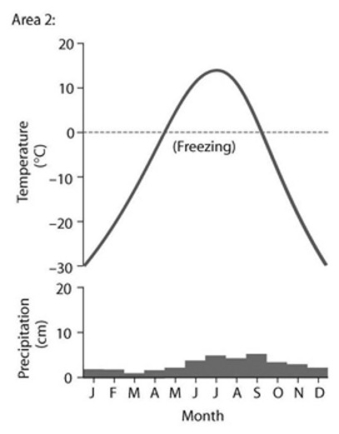
-Based on the data in the accompanying figure, which of the following statements are correct?
I. Area 1 has more average precipitation than Area 2.
II. Area 1 has a higher average temperature than Area 2.
III. Both areas have low variation in monthly precipitation.
IV. Area 2 has a lower annual temperature variation compared to Area 1.
A) only I and III
B) only II and IV
C) only I, II, and IV
D) only II, III, and IV
E) only I, II, and III
Correct Answer:

Verified
Correct Answer:
Verified
Q3: Which of the following is responsible for
Q6: <img src="https://d2lvgg3v3hfg70.cloudfront.net/TB3735/.jpg" alt=" -In the map
Q6: The diagram shows a generalized cross section
Q7: How does solar radiation (per unit area)
Q8: <img src="https://d2lvgg3v3hfg70.cloudfront.net/TB3735/.jpg" alt=" -Based
Q9: <img src="https://d2lvgg3v3hfg70.cloudfront.net/TB3735/.jpg" alt=" In the map
Q10: Which of the following levels of ecological
Q12: <img src="https://d2lvgg3v3hfg70.cloudfront.net/TB3735/.jpg" alt=" The accompanying graph
Q15: <img src="https://d2lvgg3v3hfg70.cloudfront.net/TB3735/.jpg" alt=" -Which of the
Q24: The diagram shows a generalized cross section