Multiple Choice
Exhibit 16-1
The figure below shows a sine wave at one point of a string as a function of time. 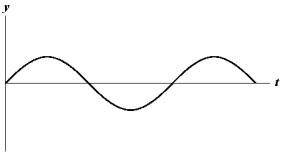 Use the exhibit to answer the following question.
-Refer to Exhibit 16-1.Which of the graphs below shows a wave where the amplitude and the frequency are doubled?
A) 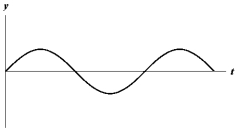
B) 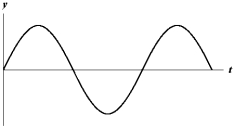
C) 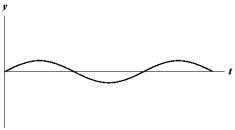
D) 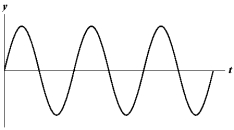
E) 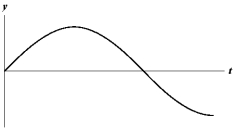
Correct Answer:

Verified
Correct Answer:
Verified
Related Questions
Q11: Exhibit 16-1 <br>The figure below shows a
Q12: What is the expression for the
Q13: The figure below represents a string
Q15: Exhibit 16-2<br>The figure below shows a sine
Q17: A friend hands you an equation
Q18: Find the period of a wave
Q31: The speed of a 10-kHz sound wave
Q40: Exhibit 16-3<br>Four wave functions are given below.<br>I.y(x,
Q60: While you are sounding a tone on
Q70: A bat, flying at 5.00 m/s, emits