Multiple Choice
Exhibit 16-1
The figure below shows a sine wave at one point of a string as a function of time. 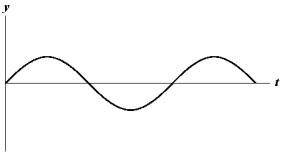 Use the exhibit to answer the following question.
-Refer to Exhibit 16-1.Which of the graphs below shows a wave where the amplitude and frequency are each reduced in half?
A) 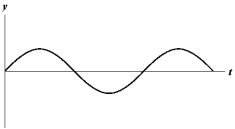
B) 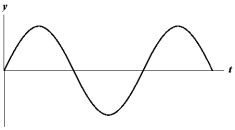
C) 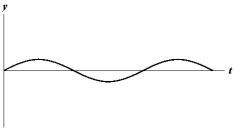
D) 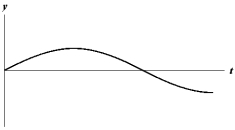
E) 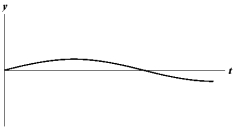
Correct Answer:

Verified
Correct Answer:
Verified
Related Questions
Q10: The variation in the pressure of
Q12: What is the expression for the
Q13: The figure below represents a string
Q15: Exhibit 16-2<br>The figure below shows a sine
Q16: Exhibit 16-1 <br>The figure below shows a
Q43: A truck moving at 36 m/s passes
Q54: Ocean waves with a wavelength of 120
Q57: If the breakers at a beach are
Q59: A car approaches a stationary police car
Q60: While you are sounding a tone on