Multiple Choice
Exhibit 10-2 The figure below shows a graph of angular velocity versus time for a man bicycling around a circular track. 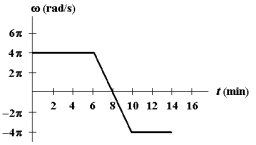 Use this exhibit to answer the following question(s) .
-Refer to Exhibit 10-2.What is his average angular acceleration,in rad/s2,in the period from t = 6 min to t = 8 min?
A) 0
B)
C)
D)
E)
Correct Answer:

Verified
Correct Answer:
Verified
Related Questions
Q1: If M = 0.50 kg,L = 1.2
Q3: A solid sphere, a solid cylinder, and
Q8: The turntable of a record player has
Q9: Two forces of magnitude 50 N,as
Q10: Two objects of mass m<sub>1</sub> = 2m
Q11: Exhibit 10-3 <br>The graph below shows
Q41: The figure below shows a graph of
Q68: A wheel starts from rest and rotates
Q69: When a wheel is rolling without slipping,
Q80: A wheel rotates about a fixed axis