Multiple Choice
The table shows the average daily high temperatures in Houston H (in degrees Fahrenheit) for month t,with t = 1 corresponding to January.
Select the correct scatter plot from the above data.
A) 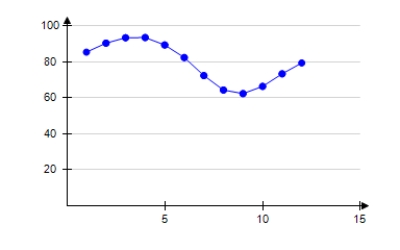
B) 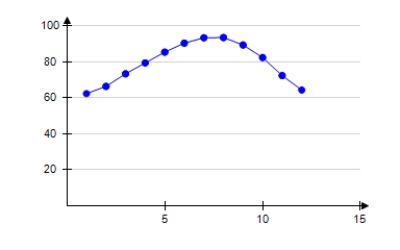
C) 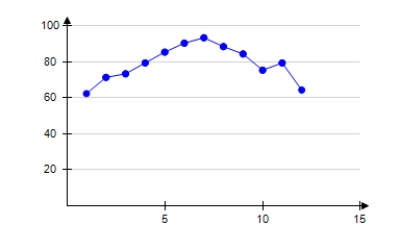
D) 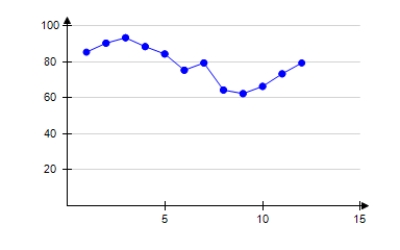
E) 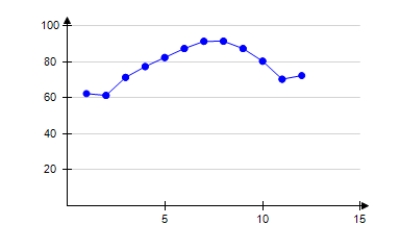
Correct Answer:

Verified
Correct Answer:
Verified
Related Questions
Q7: Solve the multiple-angle equation. <span
Q8: Solve the multiple-angle equation. <span
Q9: Solve the following equation. <br>Secx -
Q10: Solve the following equation. <span
Q11: Find all solutions of the following
Q13: Which of the following is a
Q14: Solve the multiple-angle equation. <span
Q15: Use the Quadratic Formula to solve
Q16: Solve the multiple-angle equation. <span
Q17: Use a graphing utility to graph