Multiple Choice
The projected monthly sales (in thousands of units) of lawn mowers (a seasonal product) are modeled by where t is the time (in months) ,with t = 1 corresponding to January.Select the graph of the sales function over 1 year.
A) 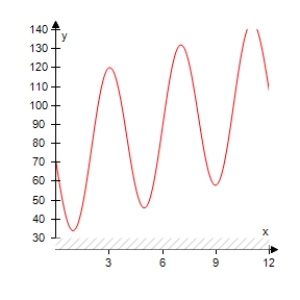
B) 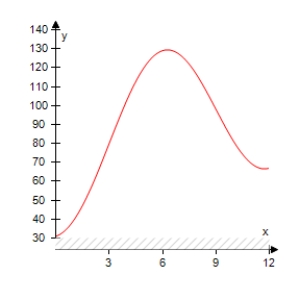
C) 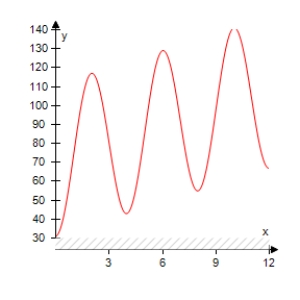
D) 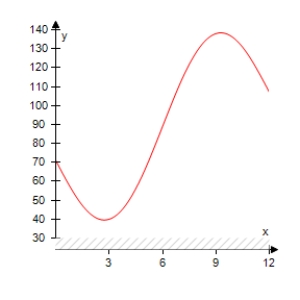
E) 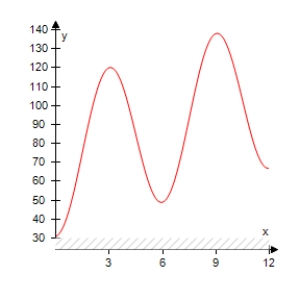
Correct Answer:

Verified
Correct Answer:
Verified
Related Questions
Q13: Select the graph of the given
Q14: Describe the behavior of the function
Q15: Use a graphing utility to select
Q16: Determine whether the function below is
Q17: A plane flying at an altitude
Q19: State the period of the function:
Q20: Select the graph of the function
Q21: State the period of the function:
Q22: Describe the behavior of the function
Q23: Determine which of the graphs below