Multiple Choice
Determine which of the graphs below represents
A) 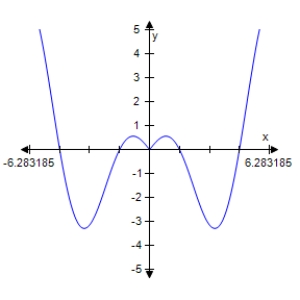
B) 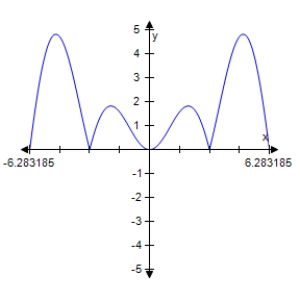
C) 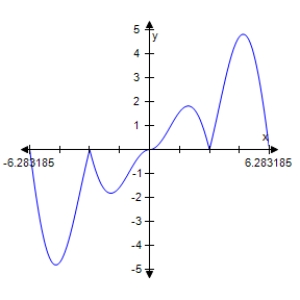
D) 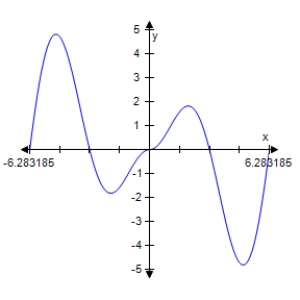
E) 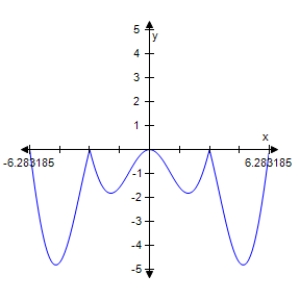
Correct Answer:

Verified
Correct Answer:
Verified
Related Questions
Q18: The projected monthly sales (in thousands
Q19: State the period of the function:
Q20: Select the graph of the function
Q21: State the period of the function:
Q22: Describe the behavior of the function
Q24: Use a graphing utility to select
Q25: Use a graphing utility to select
Q26: Select the graph of the function
Q27: Describe the behavior of the function
Q28: Use a graphing utility to select