Multiple Choice
The numbers N (in millions) of students enrolled in schools in the United States from 1995 through 1997 are shown in the table.
Use a graphing utility to create a scatter plot of the data.Let t represent the year,with t = 5 corresponding to 1995.
A) 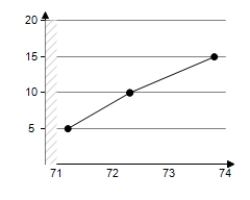
B) 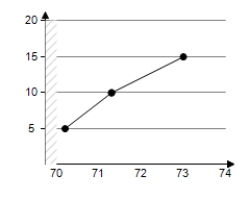
C) 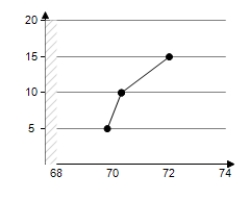
D) 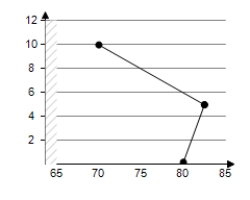
E) 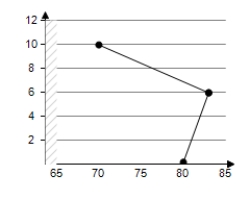
Correct Answer:

Verified
Correct Answer:
Verified
Related Questions
Q27: Find the domain of x in
Q28: Find the domain of x in
Q29: Solve the inequality and graph the
Q30: Use a graphing utility to graph
Q31: Solve the inequality and graph the
Q33: Find the domain of x in
Q34: Solve the inequality and graph the
Q35: Find the key numbers of the
Q36: Find the domain of x in
Q37: Use the position equation <span