Multiple Choice
Use the graph,which shows the average retail prices of 1 gallon of whole milk from 1996 through 2007. 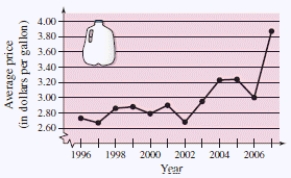 Approximate the lowest price of a gallon of whole milk shown in the graph.When did this occur?
A) $2.97 / gal;2001
B) $3.17 / gal;2002
C) $3.07 / gal;2003
D) $2.67 / gal;1997
E) $3.87 / gal;2004
Correct Answer:

Verified
Correct Answer:
Verified
Q59: Find the distance between the points
Q60: )Given points(5,-11),and (11,-5)form the vertices of the
Q61: Sketch a scatter plot of the
Q62: Let M denote the midpoint of the
Q63: Plot the points in the Cartesian plane.
Q64: Plot the points in the Cartesian plane.
Q65: Given the points (-6,-8)and (4,-6).Find a third
Q66: Let S represent the midpoint between (5,3)and
Q68: The Coca-Cola Company had sales of $19,999
Q69: Determine the quadrant(s)in which (x,y)is located so