Multiple Choice
An oceanographer took readings of the water temperatures C (in degrees Celsius) at several depths d (in meters) .The data collected are shown in the table.
Sketch a scatter plot of the data.
A) 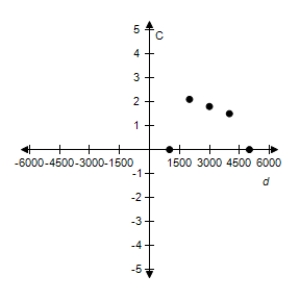
B) 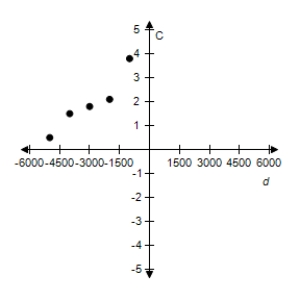
C) 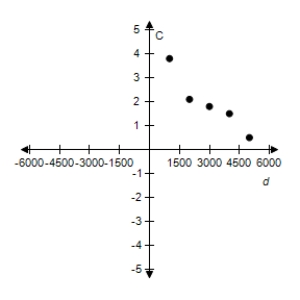
D) 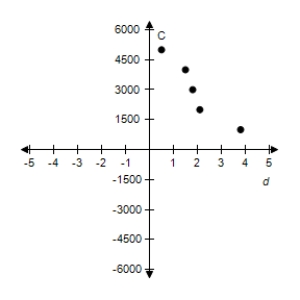
E) 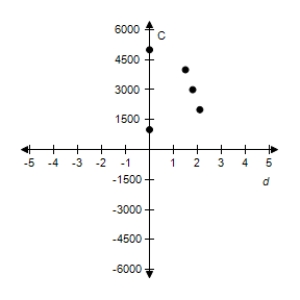
Correct Answer:

Verified
Correct Answer:
Verified
Related Questions
Q39: A force of 270 newtons stretches a
Q40: Determine whether the variation model is
Q41: Find a mathematical model representing the
Q42: Find a mathematical model representing the
Q43: Use the given value of k
Q44: Use the given value of k
Q45: The frequency of vibrations of a piano
Q47: Use the fact that the resistance of
Q48: Assume that y is directly proportional
Q49: Hooke's law states that the magnitude