Multiple Choice
Refer to the following figure when answering
Figure 5.3: Solow Diagram 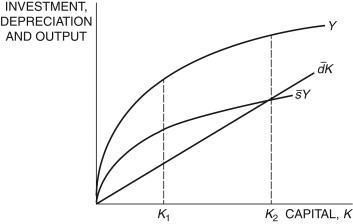
-In Figure 5.3, at K1, the difference between and
Is ________ and the difference between Y and
Is ________.
A) output; investment
B) net investment; consumption
C) gross investment; consumption
D) output; consumption
E) depreciation; gross investment
Correct Answer:

Verified
Correct Answer:
Verified
Q38: In the Solow model, the _ plays
Q51: In the simple Solow model, we assume:<br>A)
Q64: Refer to the following figure when answering
Q77: In the corn farm example, corn can
Q108: In the Solow model, in every period,
Q110: In the Solow model, if, in the
Q111: If South Korea's steady-state GDP per worker
Q114: You are asked to make comparisons of
Q115: If the production function is given
Q118: If we define <span class="ql-formula"