Multiple Choice
Refer to the following figure when answering the following questions.
Figure 5.5: Solow Diagram 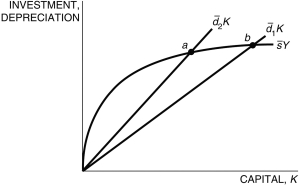
-Consider the Solow model exhibited in Figure 5.5. Which of the following is/are true?
i. If 1 denotes Country 1 and 2 denotes Country 2, Country 1 has a higher saving rate.
ii. If 1 denotes Country 1 and 2 denotes Country 2, Country 1 has a lower depreciation rate.
iii. If 1 denotes Country 1 and 2 denotes Country 2, Country 2 has a lower steady state.
A) i
B) ii
C) iii
D) ii and iii
E) i, ii, and iii
Correct Answer:

Verified
Correct Answer:
Verified
Q59: The amount of capital in an economy
Q60: Refer to the following figure when answering
Q61: In the Solow model, if we assume
Q62: An increase in _ leads to a
Q63: The equation <img src="https://d2lvgg3v3hfg70.cloudfront.net/TB6622/.jpg" alt="The equation
Q65: If we define the saving rate as
Q66: In the Solow model, defining <img src="https://d2lvgg3v3hfg70.cloudfront.net/TB6622/.jpg"
Q67: In the Solow model, if, in the
Q68: Refer to the following figure when answering
Q69: The productivity parameter, <img src="https://d2lvgg3v3hfg70.cloudfront.net/TB6622/.jpg" alt="The productivity