Multiple Choice
Refer to the following figure when answering the following questions.
Figure 5.3: Solow Diagram 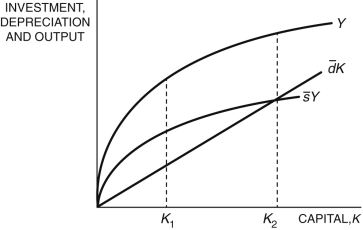
-In Figure 5.3, at K2, capital accumulation is ________, the economy is ________, and consumption is ________.
A) positive; growing; positive
B) zero; in the steady state; zero
C) negative; growing; positive
D) zero; in the steady state; positive
E) zero; contracting; negative
Correct Answer:

Verified
Correct Answer:
Verified
Q55: If the current capital stock in South
Q56: The Solow model assumes the saving rate
Q57: If we define the saving rate as
Q58: In the Solow model, net investment is
Q59: The amount of capital in an economy
Q61: In the Solow model, if we assume
Q62: An increase in _ leads to a
Q63: The equation <img src="https://d2lvgg3v3hfg70.cloudfront.net/TB6622/.jpg" alt="The equation
Q64: Refer to the following figure when answering
Q65: If we define the saving rate as