Multiple Choice
Refer to the following figure when answering
Figure 5.4: Solow Diagram 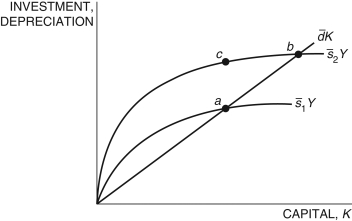
-Consider Figure 5.4, which represents two countries, 1 and 2. Country ________ has a higher saving rate and will have a ________ steady state than the other country.
A) 2; lower
B) 1; higher
C) 2; higher
D) 1; lower
E) Not enough information is given.
Correct Answer:

Verified
Correct Answer:
Verified
Q3: Refer to the following figure when
Q4: Assume a production function is given
Q6: In 1960, the Phillipines had a per
Q7: Refer to the following figure when answering
Q9: Using the Solow model, if, in
Q10: A central lesson of the Solow model
Q11: Which of the following is/are left out
Q12: In the Solow model, the parameter
Q13: Refer to the following figure when answering
Q24: The Solow model of economic growth:<br>A) endogenizes