Multiple Choice
Refer to the following figure when answering
Figure 5.4: Solow Diagram 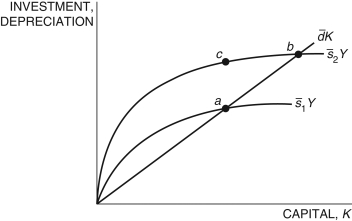
-Consider the Solow model exhibited in Figure 5.4.
Which of the following is/are true?
i. For any single country, the movement from point a to b is due to an increase in the saving rate, s1 > s2.
ii. For any single country, the movement from point c to b is due to an increase in capital stock for the saving rate, s2.
iii. If s1 and s2 stands for the saving rates in Countries 1 and 2, respectively, Country 2 has a lower saving rate.
A) i
B) ii
C) iii
D) i and ii
E) i, ii, and iii
Correct Answer:

Verified
Correct Answer:
Verified
Q4: The key insight in the Solow model
Q8: Refer to the following figure when answering
Q9: Using the Solow model, if, in
Q10: A central lesson of the Solow model
Q11: Which of the following is/are left out
Q12: In the Solow model, the parameter
Q15: Given a production function <span
Q16: In the standard production model, the productivity
Q47: What are the key assumptions of the
Q92: In the steady state, capital accumulation is