Multiple Choice
Refer to the following figure to answer
Figure 7.1: U.S. Unemployment Rate: 1975-2012 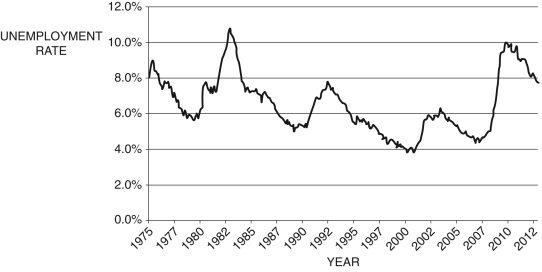 (Source: U.S. Bureau of Labor Statistics)
-Given the unemployment rate data depicted in Figure 7.1, identify the year of the peak of the boom:
A) 1993
B) 2001
C) 1983
D) 2010
E) 1992
Correct Answer:

Verified
Correct Answer:
Verified
Q38: A key reason that unemployment in the
Q39: Figure 7.7: Unemployment Rate 1975-2012 <img src="https://d2lvgg3v3hfg70.cloudfront.net/TB4306/.jpg"
Q40: Which of the following is not a
Q42: In the "bathtub model" of unemployment, in
Q44: Refer to the following figure when
Q46: The net change in employment is:<br>A) new
Q47: Refer to the following table to
Q48: Leading up to the 2010 midterm elections,
Q96: Unemployment due to workers shuffling from one
Q105: _ historically has generally had the lowest