Essay
Figure 7.7: Unemployment Rate 1975-2012 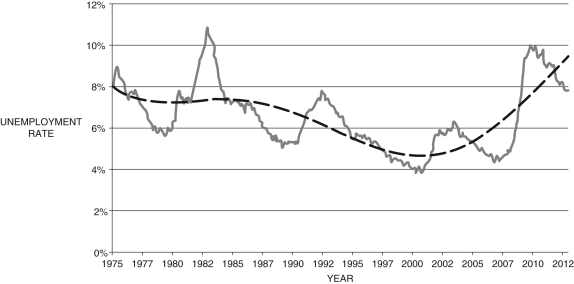 (Source: U.S. Bureau of Labor Statistics)
-Consider Figure 7.7, which shows the unemployment rate from 1975-2012.
(a) What does the dashed line represent? How can it be represented?
(b) Based solely on this data, was the period from approximately 1985-1991 an expansion or recession? Explain. What about the period 2007-2010?
(c) Based on the data presented, what is your prediction for future rates of unemployment?
Correct Answer:

Verified
(a) It is the natural rate of unemployme...View Answer
Unlock this answer now
Get Access to more Verified Answers free of charge
Correct Answer:
Verified
View Answer
Unlock this answer now
Get Access to more Verified Answers free of charge
Q13: The labor demand curve is derived from
Q36: Any institutional fixed wage set above the
Q38: A key reason that unemployment in the
Q40: Which of the following is not a
Q42: The natural rate of unemployment is equal
Q42: In the "bathtub model" of unemployment, in
Q43: Refer to the following figure to answer
Q44: Refer to the following figure when
Q96: Unemployment due to workers shuffling from one
Q102: Beginning in _, the wage premium began