Multiple Choice
Refer to the following figure when answering the next five questions.
Figure 9.2: U.S. Output Fluctuations 1960-2012 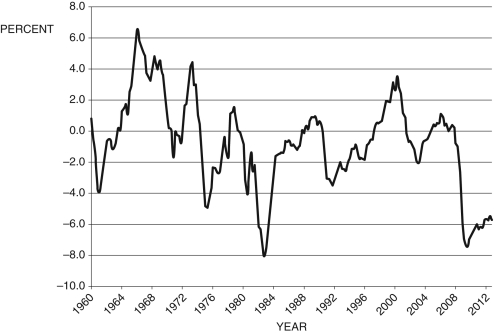
(Source: BEA and CBO, data from Federal Reserve Economic Data, St. Louis Federal Reserve)
-Consider Figure 9.2. The line represents short-run fluctuations, . Since 1960, the largest boom was in about ________ and the deepest recession was in about ________.
A) 1983; 1965
B) 1974; 1976
C) 2000; 1983
D) 1966; 1983
E) The economy always produces at its potential.
Correct Answer:

Verified
Correct Answer:
Verified
Q19: The long-run model determines _ and _.<br>A)
Q21: Figure 9.7: Cyclical Unemployment: 1980-2012 <img src="https://d2lvgg3v3hfg70.cloudfront.net/TB4306/.jpg"
Q24: If <span class="ql-formula" data-value="\tilde {
Q25: If <span class="ql-formula" data-value="\Delta \pi
Q26: Refer to the following figure when
Q27: Refer to the following figure when answering
Q28: Defining <span class="ql-formula" data-value="Y _
Q31: When current output rises above potential output,
Q38: According to the text, which of the
Q65: Which of the following is NOT an