Multiple Choice
Refer to the following figure when answering
Figure 9.4: U.S. Inflation 1990-2012 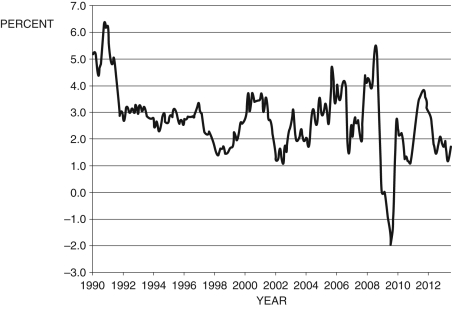
(Source: Bureau of Labor Statistics)
-Consider Figure 9.4, which shows the annual inflation rate. According to the Phillips curve, the period from about 1998 to 2000 was a period of:
A) stagnation
B) recession
C) expansion
D) None of these answers are correct.
E) Not enough information is given.
Correct Answer:

Verified
Correct Answer:
Verified
Q23: Refer to the following figure when
Q24: If <span class="ql-formula" data-value="\tilde {
Q25: If <span class="ql-formula" data-value="\Delta \pi
Q25: According to Okun's law, if the Federal
Q26: Refer to the following figure when
Q28: Defining <span class="ql-formula" data-value="Y _
Q31: When current output rises above potential output,
Q32: Refer to the following figure when answering
Q89: Which of the following is NOT an
Q98: Current output is defined as:<br>A) the amount