Multiple Choice
Refer to the following figure when answering the next five questions.
Figure 9.2: U.S. Output Fluctuations 1960-2012 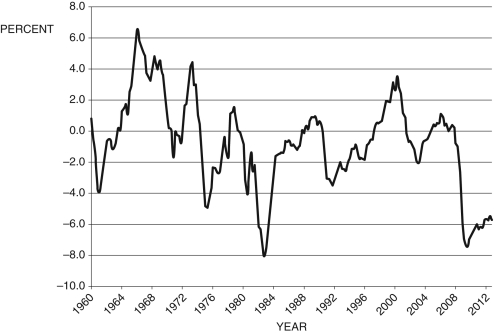
(Source: BEA and CBO, data from Federal Reserve Economic Data, St. Louis Federal Reserve)
-Consider Figure 9.2. In approximately which of the following years was current output equal to potential output?
A) 1966, 1974, 1979, 2000, and 2004
B) 1961, 1975, 1983, 2002, and 2009
C) 1964, 1980, 1991, 2001, and 2008
D) 1961, 1975, 1979, 2000, and 2008
E) 1966, 1974, 1983, 2002, and 2010
Correct Answer:

Verified
Correct Answer:
Verified
Q25: According to Okun's law, if the Federal
Q27: Refer to the following figure when answering
Q28: Defining <span class="ql-formula" data-value="Y _
Q34: According to the text, the slope of
Q35: Defining <span class="ql-formula" data-value="Y _
Q36: Defining u as the unemployment rate
Q37: Defining <span class="ql-formula" data-value="Y _
Q89: Which of the following is NOT an
Q98: Current output is defined as:<br>A) the amount
Q106: Which is responsible for dating business cycles?<br>A)