Multiple Choice
Refer to the following figure when answering the next five questions.
Figure 9.2: U.S. Output Fluctuations 1960-2012 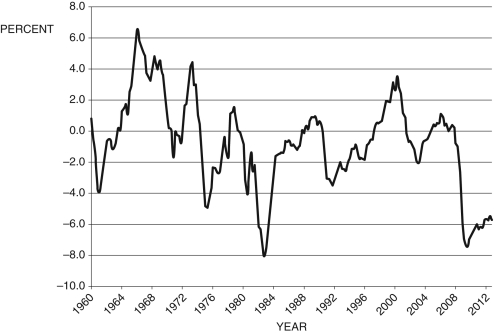
(Source: BEA and CBO, data from Federal Reserve Economic Data, St. Louis Federal Reserve)
-Consider Figure 9.2, which represents . In approximately what years did the U.S. economy experience its longest economic expansion?
A) 1964-1970
B) 1978-1980
C) 1996-2001
D) 1972-1974
E) This cannot be determined from the information given.
Correct Answer:

Verified
Correct Answer:
Verified
Q21: The Board of Governors of the Federal
Q39: What is the best definition of the
Q58: Suppose an economy's natural rate of
Q60: Refer to the following figure when answering
Q64: One implication of the Keynes quote, "In
Q67: Suppose an economy's natural rate of
Q73: According to the Phillips curve, short-term changes
Q80: New technology, oil price changes, pork-barrel spending,
Q87: Taken together, the Phillips curve and Okun's
Q95: When the U.S. economy bottomed out during