Multiple Choice
Refer to the following figure when answering
Figure 9.4: U.S. Inflation 1990-2012 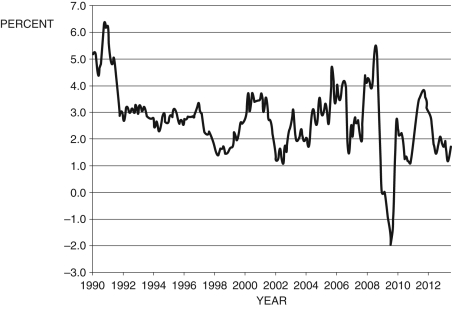
(Source: Bureau of Labor Statistics)
-Consider Figure 9.4, which shows the annual inflation rate. According to the Phillips curve, the period from about 2003 to 2005 was a period of:
A) recession
B) expansion
C) stagnation
D) None of these answers are correct.
E) Not enough information is given.
Correct Answer:

Verified
Correct Answer:
Verified
Q12: Which of the following is NOT an
Q39: What is the best definition of the
Q58: Suppose an economy's natural rate of
Q62: Refer to the following figure when
Q64: One implication of the Keynes quote, "In
Q73: According to the Phillips curve, short-term changes
Q80: New technology, oil price changes, pork-barrel spending,
Q87: Taken together, the Phillips curve and Okun's
Q95: When the U.S. economy bottomed out during
Q100: Taxes, oil price changes, government spending, interest