Multiple Choice
Figure 12.6: IS-MP Curve 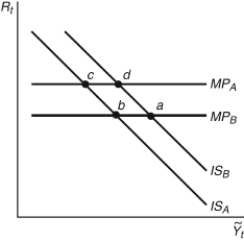
-Start from any equilibrium in Figure 12.6 to answer the following question. In 1980, U.S. inflation hit about 14 percent; Federal Reserve chairman ________ engineered a decline in inflation by ________, shown in the figure as movement from ________.
A) Volcker; raising inflation rates; point b to c
B) Bernanke; raising interest rates; point b to d
C) Volcker; lowering interest rates; point c to b
D) Volcker; raising interest rates; point b to c
E) Greenspan; lowering interest rates; point a to b
Correct Answer:

Verified
Correct Answer:
Verified
Q11: The money demand curve:<br>A) slopes downward with
Q18: The interest rate that the Fed charges
Q63: When economists say "sticky inflation," they mean:<br>A)
Q79: The federal funds rate is:<br>A) equal to
Q89: Expected inflation is:<br>A) equal to zero.<br>B) equal
Q104: Refer to the following figure when answering
Q105: In the Phillips curve, the term
Q108: Refer to the following figure when answering
Q110: Recent energy legislation that dictates increased use
Q111: Figure 12.17: Real GDP and Non-Farm Employment