Essay
Figure 12.17: Real GDP and Non-Farm Employment (1999.07 = 100) 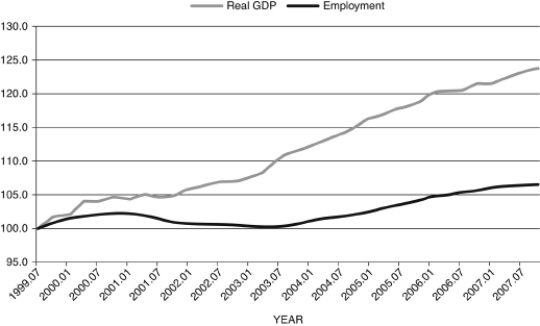
(Source: Federal Reserve Economic Data, St. Louis Federal Reserve)
-Figure 12.17 shows quarterly real GDP and non-farm employment from 1999.07-2007.07. Discuss what is notable about this relationship.
Correct Answer:

Verified
As can be seen, real GDP recovered relat...View Answer
Unlock this answer now
Get Access to more Verified Answers free of charge
Correct Answer:
Verified
View Answer
Unlock this answer now
Get Access to more Verified Answers free of charge
Q11: The money demand curve:<br>A) slopes downward with
Q18: The interest rate that the Fed charges
Q63: When economists say "sticky inflation," they mean:<br>A)
Q79: The federal funds rate is:<br>A) equal to
Q89: Expected inflation is:<br>A) equal to zero.<br>B) equal
Q103: According to the Fisher equation, the nominal
Q108: Refer to the following figure when answering
Q109: Figure 12.6: IS-MP Curve <img src="https://d2lvgg3v3hfg70.cloudfront.net/TB4306/.jpg" alt="Figure
Q110: Recent energy legislation that dictates increased use
Q115: In the Phillips curve <img src="https://d2lvgg3v3hfg70.cloudfront.net/TB4306/.jpg" alt="In