Essay
Consider Figure 12.14 below, which shows the price of oil from January 2005-December 2010. What are the impacts of this on the macroeconomy? In particular, which macroeconomic relationship does this impact? Explain.
Figure 12.14: Percent Change Oil Price 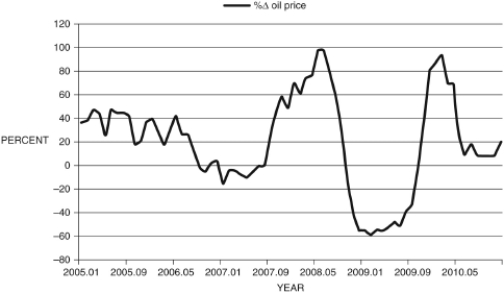
(Source: Federal Reserve Economic Data, St. Louis Federal Reserve)
Correct Answer:

Verified
Oil prices are a form of cost shock,  , ...
, ...View Answer
Unlock this answer now
Get Access to more Verified Answers free of charge
Correct Answer:
Verified
View Answer
Unlock this answer now
Get Access to more Verified Answers free of charge
Q15: Figure 12.7: Output <img src="https://d2lvgg3v3hfg70.cloudfront.net/TB6622/.jpg" alt="Figure 12.7:
Q54: Refer to the following figure when answering
Q55: Refer to the following figure when answering
Q58: In the text inflation is given
Q61: Refer to the following figure when
Q62: The Phillips curve assumes that inflation expectations
Q118: If prices are sticky and there are
Q122: One of the main missions of the
Q123: What tool does the U.S. Federal Reserve
Q131: Refer to the following figure when answering