Multiple Choice
In the graphs below, QP refers to the economy's potential output level. 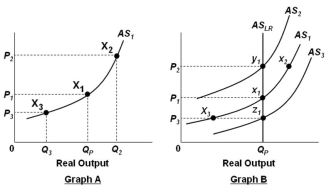 Refer to the graphs above. In Graph B, assume that the economy is initially in equilibrium at point x1 but then there is an increase in the price level from P1 to P2. In the long run, this change will lead to:
A) Lower nominal wages and a shift in the short-run aggregate supply curve from AS1 to AS2
B) Higher nominal wages and a shift in the short-run aggregate supply curve from AS1 to AS2
C) Lower nominal wages and a movement from equilibrium point x1 to equilibrium point x2
D) Higher nominal wages and a movement from equilibrium point x1 to equilibrium point x2
Correct Answer:

Verified
Correct Answer:
Verified
Q82: Assume that a person saves $50,000 and
Q83: The economy enters the long-run once:<br>A) Nominal
Q84: <img src="https://d2lvgg3v3hfg70.cloudfront.net/TB4895/.jpg" alt=" Refer to the
Q88: Which is a basic proposition of supply-side
Q89: In the graphs below, Q<sub>P</sub> refers to
Q92: <img src="https://d2lvgg3v3hfg70.cloudfront.net/TB4895/.jpg" alt=" Refer to the
Q114: Demand-pull inflation and cost-push inflation have similar
Q128: The long-run aggregate supply curve stays in
Q145: According to the simple extended AD-AS model,
Q233: The Laffer Curve suggests that within a