Multiple Choice
In the graphs below, QP refers to the economy's potential output level. 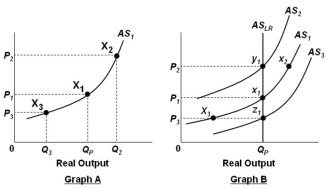 Refer to the graphs above. In Graph B, assume that the economy is initially in equilibrium at point x1 but then there is an increase in the price level from P1 to P2. This change will lead to:
A) A movement from x1 to x2 in the short run, and the unemployment rate decreases, followed by a shift from x2 to y1 as nominal wages rise in the long run
B) A movement from x1 to x3 in the short run, and the unemployment rate decreases, followed by a shift from x3 to x1 as output rises in the long run
C) A movement from x1 to y1 in the short run, and back to x1 in the long run
D) No change in the short run, but a shift from x1 to y1 in the long run
Correct Answer:

Verified
Correct Answer:
Verified
Q28: In the long run, demand-pull inflation:<br>A) Starts
Q29: When the rate of inflation is decreasing,
Q30: The analysis of the short-run and long-run
Q31: In the cost-push model of inflation, increases
Q32: If prices and wages are flexible, a
Q34: In the short-run, demand-pull inflation increases:<br>A) Real
Q36: Which presidential administration is most closely associated
Q37: In the graphs below, Q<sub>P</sub> refers to
Q38: If the government uses expansionary monetary or
Q69: According to the simple extended AD-AS model,