Multiple Choice
In the graphs below, QP refers to the economy's potential output level. 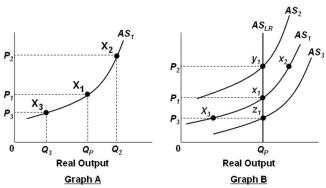 Refer to the graphs above. In Graph A, a decrease in the price level from P1 to P3 will lead to:
A) A decrease in profits, an increase in real output, and a decrease in the unemployment rate
B) A decrease in profits, a decrease in real output, and a decrease in the unemployment rate
C) A decrease in profits, a decrease in real output, and an increase in the unemployment rate
D) An increase in profits, an increase in real output, and a decrease in the unemployment rate
Correct Answer:

Verified
Correct Answer:
Verified
Q13: If wages and other input prices are
Q32: If prices and wages are flexible, a
Q33: In the graphs below, Q<sub>P</sub> refers to
Q34: In the short-run, demand-pull inflation increases:<br>A) Real
Q36: Which presidential administration is most closely associated
Q38: If the government uses expansionary monetary or
Q39: Equilibrium in the long run occurs when:<br>A)
Q41: <img src="https://d2lvgg3v3hfg70.cloudfront.net/TB4895/.jpg" alt=" Refer to the
Q42: To convey the point about supply-side economics,
Q69: According to the simple extended AD-AS model,