Multiple Choice
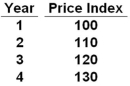 Refer to the table above. What would be the annual inflation rates in Years 2, 3, and 4, respectively?
A) 10, 9.1, and 8.3 percent
B) 10, 8.3, and 7.7 percent
C) 10, 10, and 10 percent
Correct Answer:

Verified
Correct Answer:
Verified
Q13: If wages and other input prices are
Q41: <img src="https://d2lvgg3v3hfg70.cloudfront.net/TB4895/.jpg" alt=" Refer to the
Q42: To convey the point about supply-side economics,
Q43: Disinflation can be explained by the Phillips
Q47: Adverse aggregate-supply shocks or stagflation would cause
Q48: With demand-pull inflation in the extended AD-AS
Q49: <img src="https://d2lvgg3v3hfg70.cloudfront.net/TB4895/.jpg" alt=" Refer to the
Q50: Demand-pull inflation in the short-run raises the
Q75: A rightward shift of the Phillips Curve
Q85: The Phillips Curve shows a positive relationship