Multiple Choice
 Refer to the graph above. If Qf is potential GDP, wages and prices are flexible, then the long-run aggregate supply curve will be:
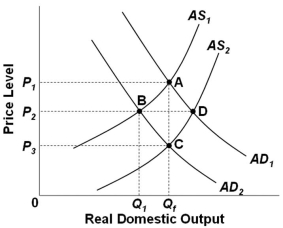
A) AS2
B) AS1
C) A vertical line at Qf
D) A vertical line at Q1
Correct Answer:

Verified
Correct Answer:
Verified
Q13: If wages and other input prices are
Q36: Which presidential administration is most closely associated
Q37: In the graphs below, Q<sub>P</sub> refers to
Q38: If the government uses expansionary monetary or
Q39: Equilibrium in the long run occurs when:<br>A)
Q42: To convey the point about supply-side economics,
Q43: Disinflation can be explained by the Phillips
Q45: <img src="https://d2lvgg3v3hfg70.cloudfront.net/TB4895/.jpg" alt=" Refer to the
Q75: A rightward shift of the Phillips Curve
Q85: The Phillips Curve shows a positive relationship