Multiple Choice
 Refer to the graph above, which shows an aggregate demand curve. If the price level decreases from 200 to 100, the real output demanded will:
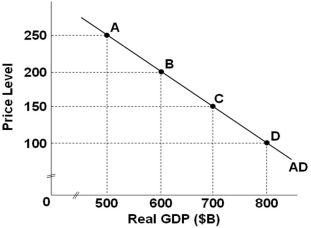
A) Increase by $800 billion
B) Increase by $200 billion
C) Decrease by $600 billion
D) Decrease by $200 billion
Correct Answer:

Verified
Correct Answer:
Verified
Q63: In an economy, it costs $1,500 to
Q100: When the stock market crashed in 2008,
Q101: <img src="https://d2lvgg3v3hfg70.cloudfront.net/TB4895/.jpg" alt=" Refer to the
Q102: A decrease in business taxes will tend
Q103: Which of the following effects best explains
Q104: The upward slope of the short-run aggregate
Q107: Which of the following events would most
Q108: If the price level decreases, then the
Q109: An expected increase in the prices of
Q128: The so-called ratchet effect refers to the