Multiple Choice
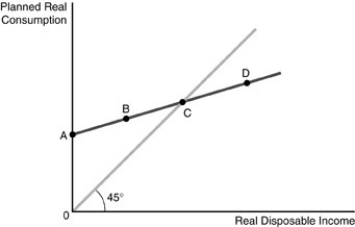
-Refer to the above figure. The figure represents the consumption function for a consumer. Point A represents
A) autonomous consumption.
B) positive saving.
C) negative consumption.
D) zero saving.
Correct Answer:

Verified
Correct Answer:
Verified
Q21: If the MPC is 0.75, then the
Q22: <img src="https://d2lvgg3v3hfg70.cloudfront.net/TB5018/.jpg" alt=" -In the above
Q23: Along the 45° reference line<br>A) consumption expenditures
Q24: <img src="https://d2lvgg3v3hfg70.cloudfront.net/TB5018/.jpg" alt=" Note: Amounts in
Q25: When the average propensity to save (APS)
Q27: Ignoring the government and foreign sectors, equilibrium
Q28: The consumption function shows<br>A) a positive relationship
Q29: Distinguish between saving and savings. How does
Q30: If consumption is $650 when real disposable
Q31: <img src="https://d2lvgg3v3hfg70.cloudfront.net/TB5018/.jpg" alt=" -Use the above