Multiple Choice
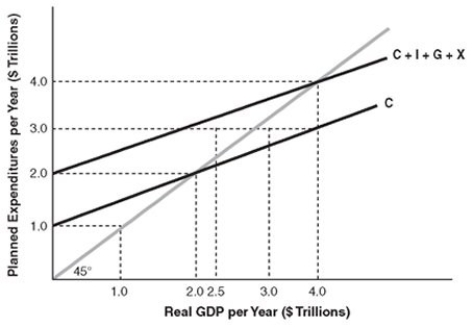
-In the above figure, at the equilibrium level of real GDP, there is
A) positive saving.
B) negative saving.
C) zero saving.
D) a negative tax rate.
Correct Answer:

Verified
Correct Answer:
Verified
Q17: A situation in which spending exceeds income
Q18: At a given interest rate, the investment
Q19: <img src="https://d2lvgg3v3hfg70.cloudfront.net/TB5018/.jpg" alt=" -Consider the above
Q20: The consumption function relates<br>A) a household's consumption
Q21: If the MPC is 0.75, then the
Q23: Along the 45° reference line<br>A) consumption expenditures
Q24: <img src="https://d2lvgg3v3hfg70.cloudfront.net/TB5018/.jpg" alt=" Note: Amounts in
Q25: When the average propensity to save (APS)
Q26: <img src="https://d2lvgg3v3hfg70.cloudfront.net/TB5018/.jpg" alt=" -Refer to the
Q27: Ignoring the government and foreign sectors, equilibrium