Essay
The following data on prices and quantities for the years 1995 and 2000 are given for three products. 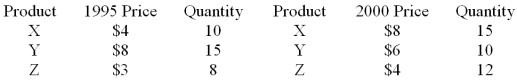 Calculate the Paasche index.
Correct Answer:

Verified
Correct Answer:
Verified
Q8: Two forecasting models were used to predict
Q9: Which of the following time-series forecasting methods
Q10: Given the following data <img src="https://d2lvgg3v3hfg70.cloudfront.net/TB1737/.jpg" alt="Given
Q11: <img src="https://d2lvgg3v3hfg70.cloudfront.net/TB1737/.jpg" alt=" Use this equation
Q12: Given the following data <img src="https://d2lvgg3v3hfg70.cloudfront.net/TB1737/.jpg" alt="Given
Q14: Two forecasting models were used to predict
Q15: Two forecasting models were used to predict
Q16: Removing the seasonal affect by dividing the
Q17: Consider the quarterly production data (in thousands
Q130: A forecasting method that weights recent observations