Essay
Consider the quarterly production data (in thousands of units)for the XYZ manufacturing company below.The normalized (adjusted)seasonal factors are .9982,.9263,1.139,.9365 for winter,spring,summer and fall respectively. 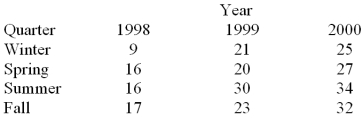 Based on the following deseasonalized observations (dt)given below,a trend line was estimated.The linear regression trend equation is: trt = 10.1 + 1.91 (t).Based on this trend equation,the following trend values are calculated for each period in the time series:
 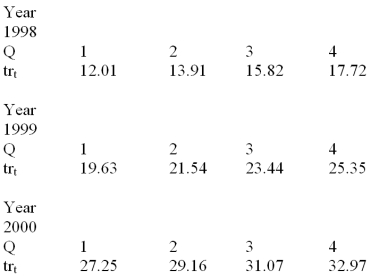 Isolate the cyclical and irregular components by calculating the estimate of CLt* IRt for the first four quarters in the time series.
Correct Answer:

Verified
.75,1.242,...View Answer
Unlock this answer now
Get Access to more Verified Answers free of charge
Correct Answer:
Verified
View Answer
Unlock this answer now
Get Access to more Verified Answers free of charge
Q12: Given the following data <img src="https://d2lvgg3v3hfg70.cloudfront.net/TB1737/.jpg" alt="Given
Q13: The following data on prices and quantities
Q14: Two forecasting models were used to predict
Q15: Two forecasting models were used to predict
Q16: Removing the seasonal affect by dividing the
Q19: Use the following information for the three
Q20: Listed below are the price of a
Q21: When using simple exponential smoothing,the more recent
Q22: A restaurant has been experiencing higher sales
Q130: A forecasting method that weights recent observations