Multiple Choice
A CFO is looking at how much of a company's resources are spent on computing.He samples companies in the pharmaceutical industry and developed the following stem-and-leaf graph. 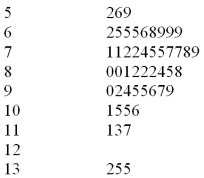 If a frequency histogram were to be created using these data,how many classes would you create?
A) 4
B) 5
C) 6
D) 7
E) 8
Correct Answer:

Verified
Correct Answer:
Verified
Related Questions
Q2: Which of the following graphical tools is
Q3: The number of items rejected daily by
Q5: A(n)_ is a graph of a cumulative
Q6: A _ is a graph of cumulative
Q8: A CFO is looking at how much
Q10: The following is a relative frequency distribution
Q14: If there are 62 values in a
Q19: The percentage of measurements in a class
Q21: _ and _ are used to describe
Q82: When establishing the classes for a frequency