Essay
The following is a relative frequency distribution of grades in an introductory statistics course. 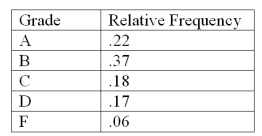 Construct a percent frequency bar chart for this data.
Correct Answer:

Verified
Correct Answer:
Verified
Related Questions
Q5: A(n)_ is a graph of a cumulative
Q6: A _ is a graph of cumulative
Q7: A CFO is looking at how much
Q8: A CFO is looking at how much
Q13: A _ shows the relationship between two
Q14: If there are 62 values in a
Q14: When grouping a large sample of items
Q15: A graphical display of categorical data made
Q19: The percentage of measurements in a class
Q82: When establishing the classes for a frequency