Multiple Choice
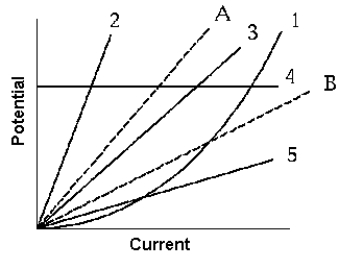 The dashed lines represent graphs of the potential as a function of the current for two resistors A and B, respectively. The curve that might reasonably represent a graph of the data taken when the resistors are connected in series is
A) 1
B) 2
C) 3
D) 4
E) 5
Correct Answer:

Verified
Correct Answer:
Verified
Q3: Use the following figures to answer
Q17: A wire of length L = 5.0
Q19: <img src="https://d2lvgg3v3hfg70.cloudfront.net/TB6081/.jpg" alt=" The curve that
Q20: A potential difference of 120 V
Q21: A galvanometer has an internal resistance
Q48: Each of three identical electric heaters is
Q84: Wire A,which is of the same length
Q93: A 0.12- <span class="ql-formula" data-value="\mu"><span class="katex"><span
Q99: Doubling the resistance in an RC circuit<br>A)doubles
Q102: When two identical resistors are connected in