Multiple Choice
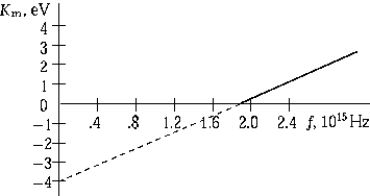 The graph shows the maximum kinetic energy of electrons emitted by a photosensitive surface as a function of the frequency of the incident radiation. The slope of this curve represents
A) the intensity of the incident radiation.
B) the maximum kinetic energy.
C) the threshold frequency.
D) Planck's constant.
E) the stopping potential.
Correct Answer:

Verified
Correct Answer:
Verified
Q12: Photons with an energy of 7.52 eV
Q15: A Compton-scattered X-ray photon has less energy
Q33: Photon A has twice the energy of
Q64: The ground-state energy of hydrogen is -13.6
Q67: <img src="https://d2lvgg3v3hfg70.cloudfront.net/TB6081/.jpg" alt=" The scaling of
Q69: What is the momentum (in SI
Q85: A proton (rest energy = 938
Q105: A gamma-ray photon of energy 100
Q126: Magnetic Resonance Imaging (MRI)is a much used
Q136: An X-ray photon of wavelength 0.10 nm