Multiple Choice
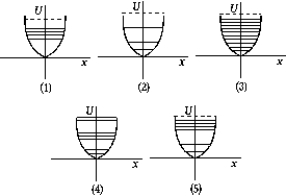 The scaling of both axes in the graphs shown are the same. The graph that best represents the energy levels of a harmonic oscillator is
A) 1
B) 2
C) 3
D) 4
E) 5
Correct Answer:

Verified
Correct Answer:
Verified
Related Questions
Q12: Photons with an energy of 7.52 eV
Q15: A Compton-scattered X-ray photon has less energy
Q33: Photon A has twice the energy of
Q64: The ground-state energy of hydrogen is -13.6
Q65: <img src="https://d2lvgg3v3hfg70.cloudfront.net/TB6081/.jpg" alt=" The graph shows
Q72: <img src="https://d2lvgg3v3hfg70.cloudfront.net/TB6081/.jpg" alt=" The graph that
Q85: A proton (rest energy = 938
Q105: A gamma-ray photon of energy 100
Q133: The maximum kinetic energy of electrons ejected
Q136: An X-ray photon of wavelength 0.10 nm