Multiple Choice
Plot the graph of the function f in an appropriate viewing window.
A) 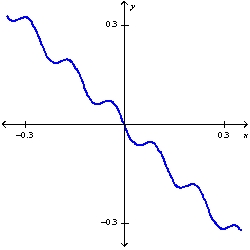
B) 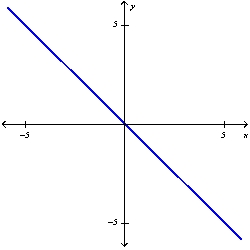
C) 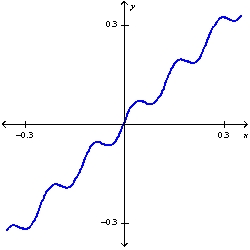
D) 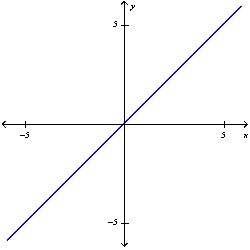
Correct Answer:

Verified
Correct Answer:
Verified
Related Questions
Q48: Use the Law of Exponents to
Q49: If f (x) = <span
Q50: In the function <span class="ql-formula"
Q51: Find the domain of the function
Q52: The graph shown gives the weight of
Q54: If <span class="ql-formula" data-value="f(x)=x+5"><span class="katex"><span
Q55: Find the domain, range, and x-intercept(s)
Q56: Find the points of intersection of
Q57: Which of the following graphs is
Q58: Find <span class="ql-formula" data-value="f^{-1}"><span class="katex"><span