Multiple Choice
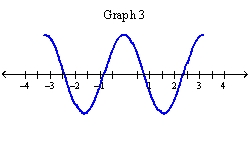
Which of the following graphs is the graph of the function? 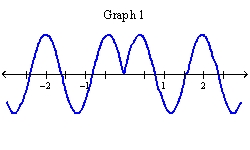
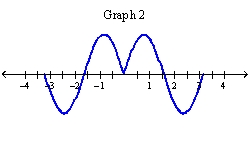
A) Graph 2
B) Graph 1
C) Graph 3
Correct Answer:

Verified
Correct Answer:
Verified
Related Questions
Q52: The graph shown gives the weight of
Q53: Plot the graph of the function
Q54: If <span class="ql-formula" data-value="f(x)=x+5"><span class="katex"><span
Q55: Find the domain, range, and x-intercept(s)
Q56: Find the points of intersection of
Q58: Find <span class="ql-formula" data-value="f^{-1}"><span class="katex"><span
Q59: If <span class="ql-formula" data-value="f(x)=3 x+\ln
Q60: A rectangle has perimeter 14 m.
Q61: Let <span class="ql-formula" data-value="f(x)=x^{2}-6 x+5"><span
Q62: Use the laws of logarithms to