Essay
The following is a relative frequency distribution of grades in an introductory statistics course. 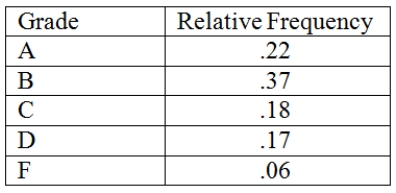 Construct a percent frequency bar chart for this data.
Correct Answer:

Verified
Correct Answer:
Verified
Related Questions
Q10: A scatter plot can be used to
Q30: A frequency table includes row and column
Q45: Key performance indicators are best represented by
Q46: A _ shows the relationship between two
Q66: A treemap graphic is a series of
Q67: Recently an advertising company called 200 people
Q72: A histogram that tails out toward smaller
Q74: The number of weekly sales calls by
Q80: Data drill down is a form of
Q82: Sparklines always need to be displayed with