Essay
Recently an advertising company called 200 people and asked them to identify the company that was in an ad running nationwide.They obtained the following results. 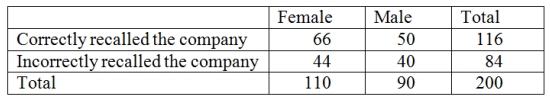 Construct a table of column percentages.
Correct Answer:

Verified
Correct Answer:
Verified
Related Questions
Q4: In a Pareto chart, the bar for
Q10: A scatter plot can be used to
Q30: A frequency table includes row and column
Q45: Key performance indicators are best represented by
Q46: A _ shows the relationship between two
Q62: The sample cumulative distribution function is nondecreasing.
Q66: A treemap graphic is a series of
Q69: The following is a relative frequency distribution
Q72: A histogram that tails out toward smaller
Q82: Sparklines always need to be displayed with