Multiple Choice
Exhibit 3-1 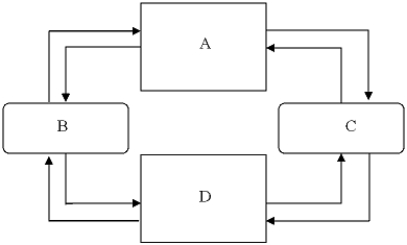
-Refer to Exhibit 3-1. In the graph of the circular flow model, area B represents
A) product markets.
B) firms.
C) factor markets.
D) households.
Correct Answer:

Verified
Correct Answer:
Verified
Q161: An economy's production possibility curve will be
Q162: A decrease in the unemployment rate from
Q163: Exhibit 3-13 <img src="https://d2lvgg3v3hfg70.cloudfront.net/TB5768/.jpg" alt="Exhibit 3-13
Q164: Which of the following concepts are illustrated
Q165: A decrease in the unemployment rate will
Q167: From a point inside the production possibility
Q168: The economic system of which of the
Q169: Economic growth can be illustrated by:<br>A)a movement
Q170: Exhibit 3-3 <img src="https://d2lvgg3v3hfg70.cloudfront.net/TB5768/.jpg" alt="Exhibit 3-3
Q171: Draw a picture of a production possibilities