Multiple Choice
Exhibit 16-1.The following Excel scatterplot with the fitted quadratic regression equation illustrates the observed relationship between productivity and the number of hired workers. 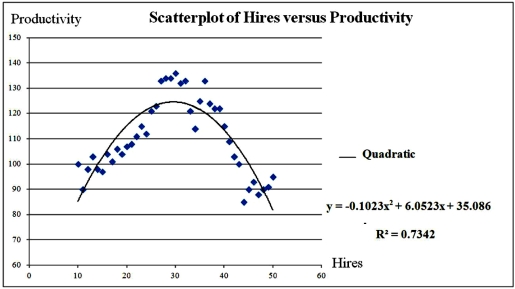 Refer to Exhibit 16.1.What is the percentage of variations in the productivity explained by the number of hired workers?
A) 85.69%
B) 0.7342%
C) 90.54%
D) 73.42%
Correct Answer:

Verified
Correct Answer:
Verified
Q32: The fit of the models y =
Q46: The cubic regression model,y = β<sub>0</sub> +
Q80: Exhibit 16-4.The following data shows the cooling
Q84: How many coefficients have to be estimated
Q85: Exhibit 16.2.Typically,the sales volume declines with an
Q86: The curve representing the regression equation <img
Q87: Exhibit 16.2.Typically,the sales volume declines with an
Q88: Exhibit 16-4.The following data shows the cooling
Q105: For the model ln(y)= β<sub>0</sub> + β<sub>1</sub>ln(x)+
Q108: In the model ln(y) = β<sub>0</sub> +