Multiple Choice
Exhibit 16.2.Typically,the sales volume declines with an increase of a product price.It has been observed,however,that for some luxury goods the sales volume may increase when the price increases.The following Excel output illustrates this rather unusual relationship. 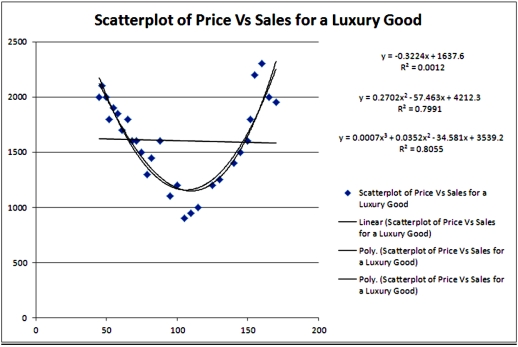 Refer to Exhibit 16.2.For which price do sales predicted by the quadratic equation reach their minimum?
A) 106.33
B) 1157.16
C) 100.41
D) 1166.64
Correct Answer:

Verified
Correct Answer:
Verified
Q83: Exhibit 16-1.The following Excel scatterplot with the
Q84: How many coefficients have to be estimated
Q85: Exhibit 16.2.Typically,the sales volume declines with an
Q86: The curve representing the regression equation <img
Q88: Exhibit 16-4.The following data shows the cooling
Q89: The fit of the regression equations <img
Q90: Exhibit 16.2.Typically,the sales volume declines with an
Q91: Exhibit 16.6.Thirty employed single individuals were randomly
Q92: The linear and logarithmic models,y = β<sub>0</sub>
Q108: In the model ln(y) = β<sub>0</sub> +