Multiple Choice
Exhibit 16-1.The following Excel scatterplot with the fitted quadratic regression equation illustrates the observed relationship between productivity and the number of hired workers. 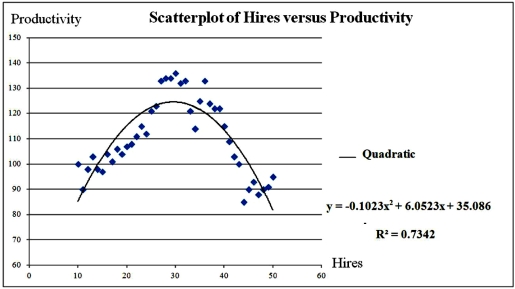 Refer to Exhibit 16.1.Predict the productivity when 32 workers are hired.
A) 124.00
B) 122.46
C) 121.60
D) 113.50
Correct Answer:

Verified
Correct Answer:
Verified
Q54: The logarithmic and log-log models,y = β<sub>0</sub>
Q55: Exhibit 16.6.Thirty employed single individuals were randomly
Q56: The fit of the models y =
Q57: Exhibit 16-7.It is believed that the sales
Q58: Which of the regression models is most
Q60: For the quadratic regression equation <img src="https://d2lvgg3v3hfg70.cloudfront.net/TB2339/.jpg"
Q62: Exhibit 16-7.It is believed that the sales
Q63: Exhibit 16-4.The following data shows the cooling
Q64: Exhibit 16.2.Typically,the sales volume declines with an
Q85: The coefficient of determination R<sup>2</sup> cannot be